


Where does uncertainty come from?
Reflections from an amateur

Trigger warning: there will be some butchery here. That is, amateur butchering of concepts. 🔪
The two main camps in statistics are frequentists and bayesians. There are many differences between them, ranging from the disciplines they’re concentrated in (Econometricians seem to be mainly frequentists, so far as I can tell), to which software languages they write in, and of course to their fundamental conceptual underpinnings for statistics. One difference is this: frequentists think of uncertainty as arising from the data, and bayesians from the parameters. Let’s explore.
Basically, frequentists think that relationships you find in the data just are. Let’s say you have some data; what’s the coefficient on your predictor? There’s a cloud of points; you solve for the slope of the plane of best fit and that’s it. That’s your estimate. 📈
The catch is: your data could have been different. You could have obtained a different sample from the population of interest, and the slope that “just was” with the dataset you had yesterday no longer is. There is a new slope that “just is”. So, for any given dataset, there is a relationship that’s simply there, waiting to be computed. But the dataset could have been different, and the range of datasets that you could have are the source of the uncertainty in the parameter that you’re estimating.
With bayesians, it’s the data that “just is”. But the parameters that you happen to observe could have been different. Bayesians think of data as having been generated by some underlying process with certain parameters. To “model” the data you basically go: “could my data have been generated by a plane with a slope of 1?” And then you answer: “if it were generated by a slope of 1, then it would look the way it does now 10% of the time”. And then you repeat that question an ~infinity of times, once for every possible slope. (Bayesian algorithms are all an approximation of this exhaustive search). Then you weight the slopes by how often data generated by that slope would look like your data.
For example, it may be the case that data generated from a process with a slope of 1 would have the highest chance of looking like your data, but data generated with a slope of 1.05 would also have a very high chance of looking like your data. Then 1.05 will be within your range of plausible uncertainty.
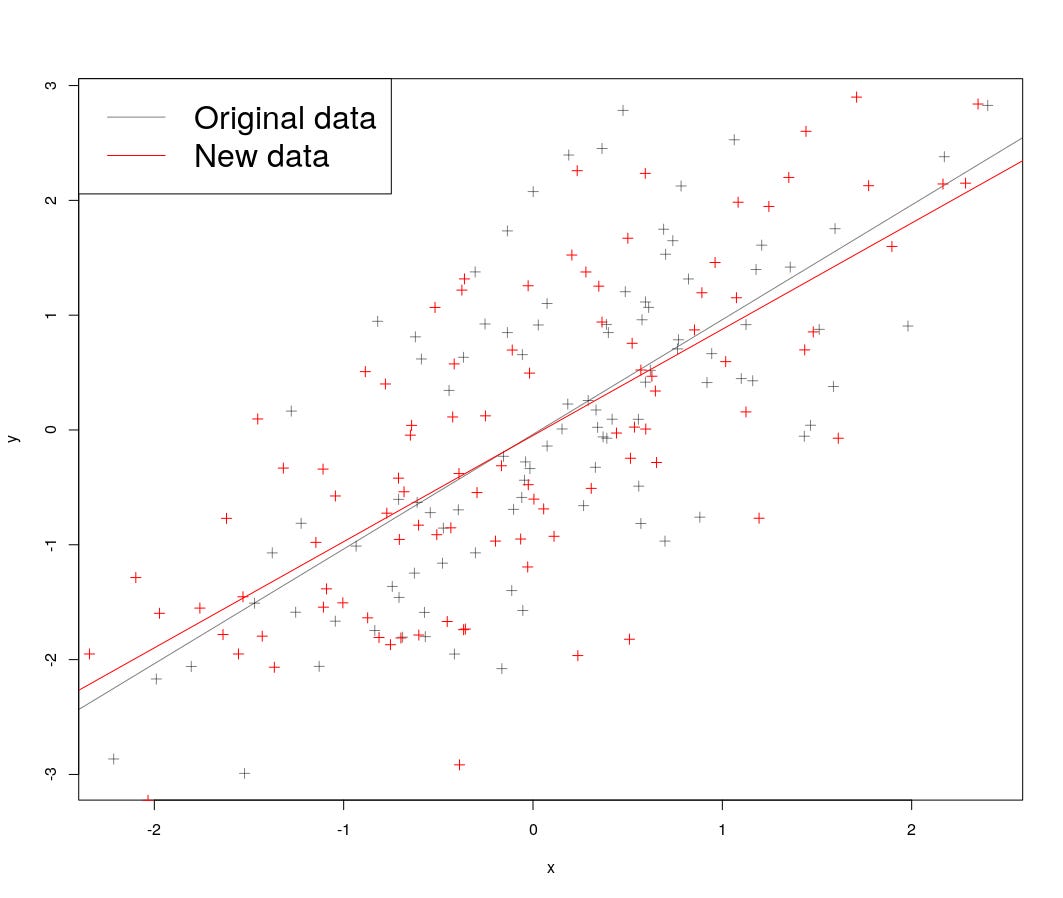
Visually, the two sources of uncertainty look like this. For the frequentists, it’s like the plot below. The grey data points are your actual data points, and the red data points are slightly different data that came from the same population. The grey line was your original slope, and the red line is the slope that you would have gotten with the red data points.
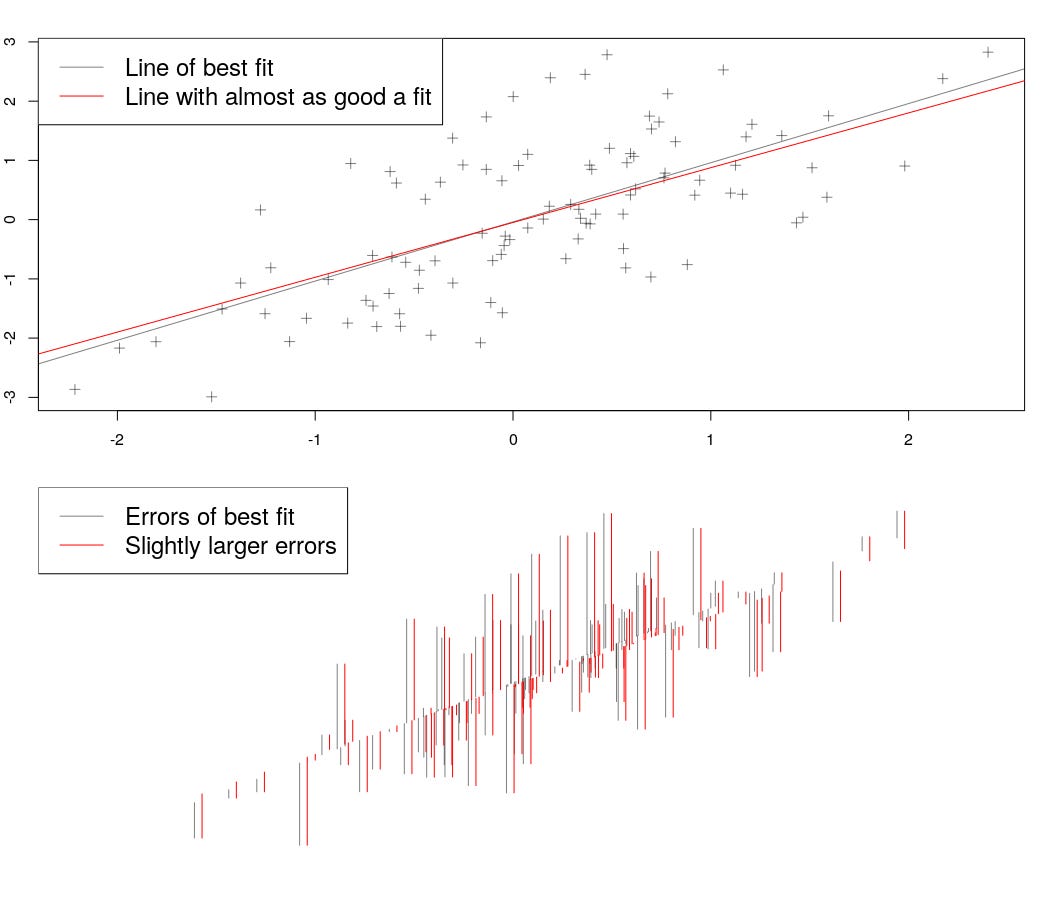
For the bayesians, it’s like the plot below. If we change the slope of the line a bit, we change the errors a bit too. In the bottom panel, I’ve shown the errors next to each other; you can see that for the most part they are almost the same. Now if we change the slope a lot, the errors will blow up. But within a range, the errors won’t change much, and the slope is almost as plausible as the line of best fit.
It’s amazing to me that these completely different conceptions of uncertainty give reasonably similar answers, even for simple problems, but -- at least for simple problems -- they do, as the plot of plausible slopes resulting from a model regressing 100 normally distributed points with a slope of zero shows.

Finally, I want to add a personal note. I am just getting this newsletter off the ground and want it to reach as wide an audience as possible; to do so, I need your help! First and foremost, if you like what I’m doing here, please share it with other folks that you think might like it.
✨My goal right now is to get to my first 100 subscribers! You can help me do that! ✨
Shouting into the void has its time and place, but not here!
Also, if you reply to this email with thoughts or feedback, that would be incredible. I’ll get the email, and we can chat about whatever you found interesting (or hated).
Thank you for reading,
Tom